

Data Democratised
Every ride at a World Championships or an Olympic Games is timed to the thousandth of a second, every 125 metres, and published. Almost everyone reads it. Almost no one stores and makes sense of it. The sheets sit in a results archive, one PDF per round, and the story they tell stays inside the teams who already know it.
I’ve spent fifteen years on the inside of those teams. The numbers on this page are the ones we used to argue about on the track centre : who’s fast in position two, whether the third man is fading, how many watts a bronze is from a gold. I’ve pulled every top-eight ride in the team sprint and team pursuit from the 2013 Worlds to Shanghai 2026 and the last three Olympics — 1,246 rides, 13,600 splits — cleaned them, checked them against the printed results, and built tools so you can ask the same questions.
Replay any round on a virtual velodrome and watch the gaps open in real time. Line up rides from different eras against each other. Take a team apart lap by lap and see where the race was won. Or add fifty watts to a rider and find out whether it would have changed the medal. The power figures are estimates from a stated model; the times are not. Everything else is yours to explore.
The sport has got faster. Where it got faster — and where it hasn’t — is in here.
Let me know what you think of it.
Enjoy.
Mehdi
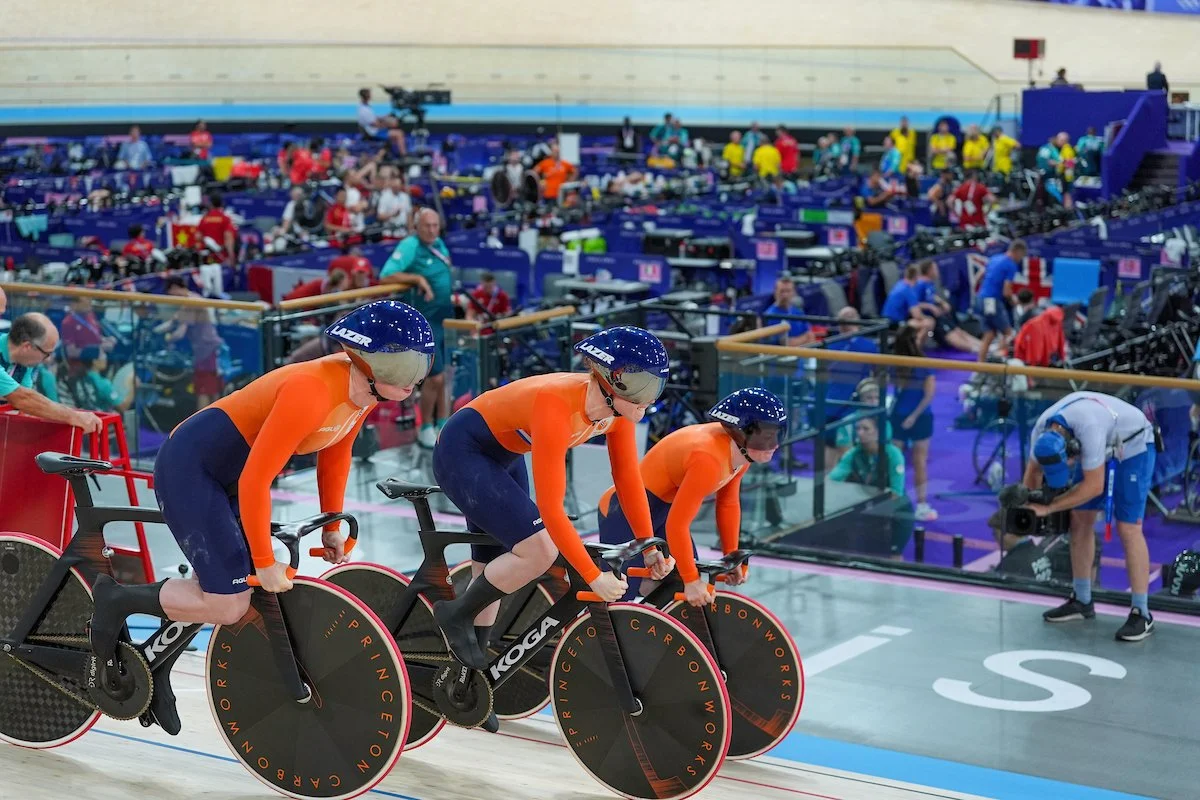
Track Cycling: Team Replay
A ghost race on a 250m velodrome: pick any round, or any eight rides from any years, and watch them unfold in real time with live gaps in metres and seconds. Covers every top-8 team sprint and team pursuit ride at the Worlds and the last three Olympics.
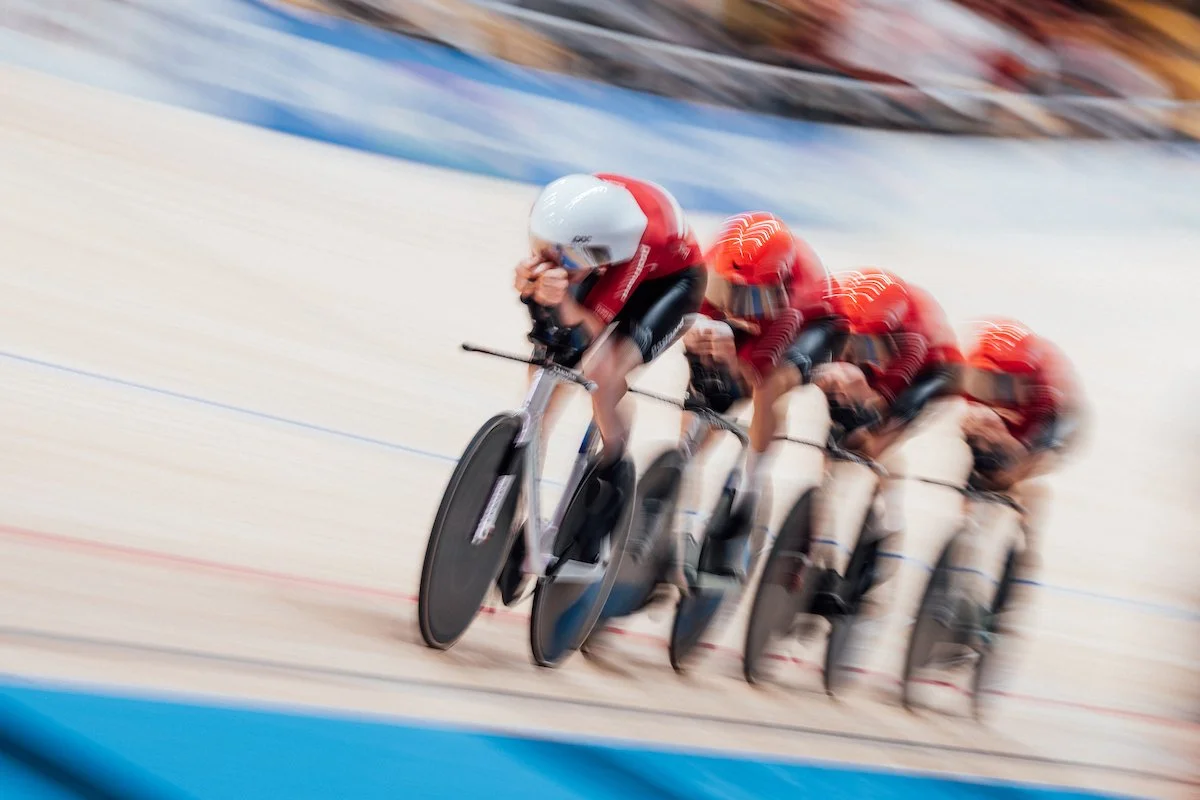
Track Cycling: Team Pursuit Data Bank
The same for the team pursuit, lap by lap and kilometre by kilometre: compare up to five rides, field average vs the gold ride by year, fastest kilometres ever, and a composite “perfect pursuit” from the best lap at each point.
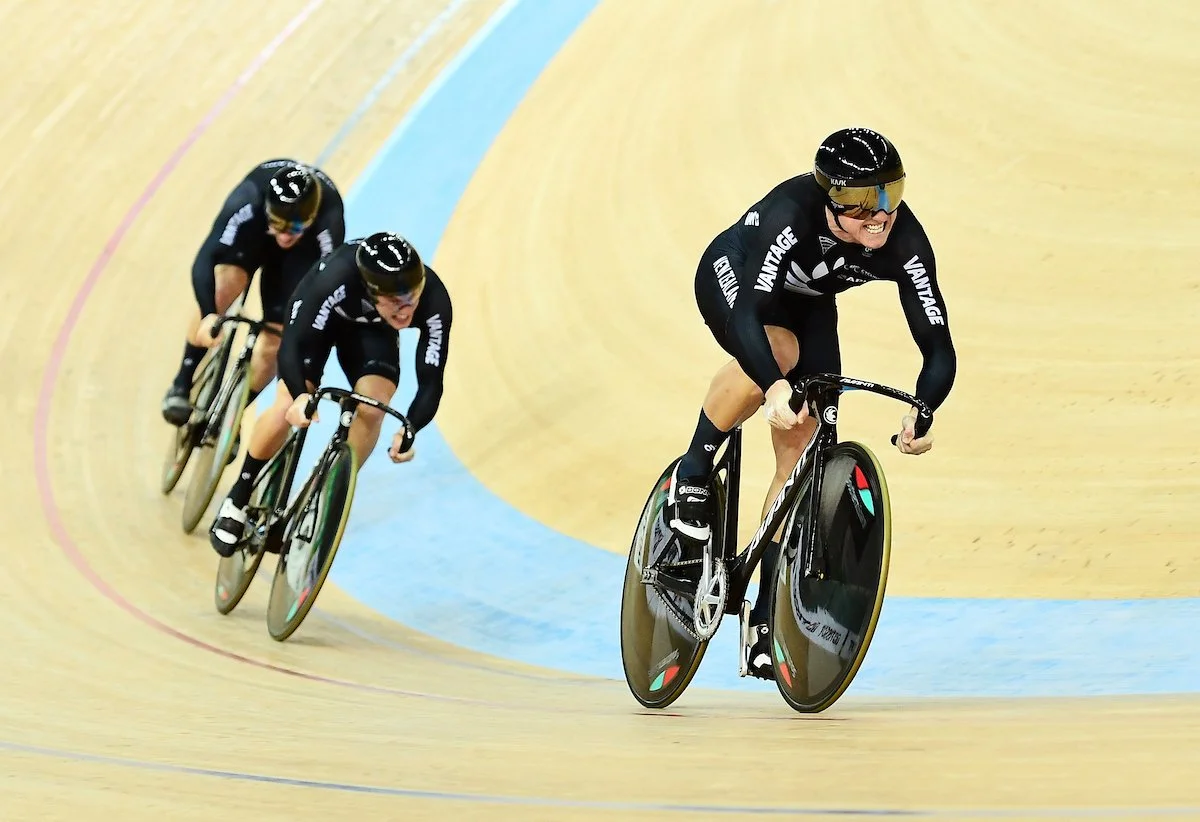
Track Cycling: What-If Team Even Simulator
Take any real ride, estimate the power its splits imply, then add or remove watts (whole ride or one position/kilometre) or change CdA, and see the new splits and where it would have finished against that day’s field. A model, with its assumptions stated.
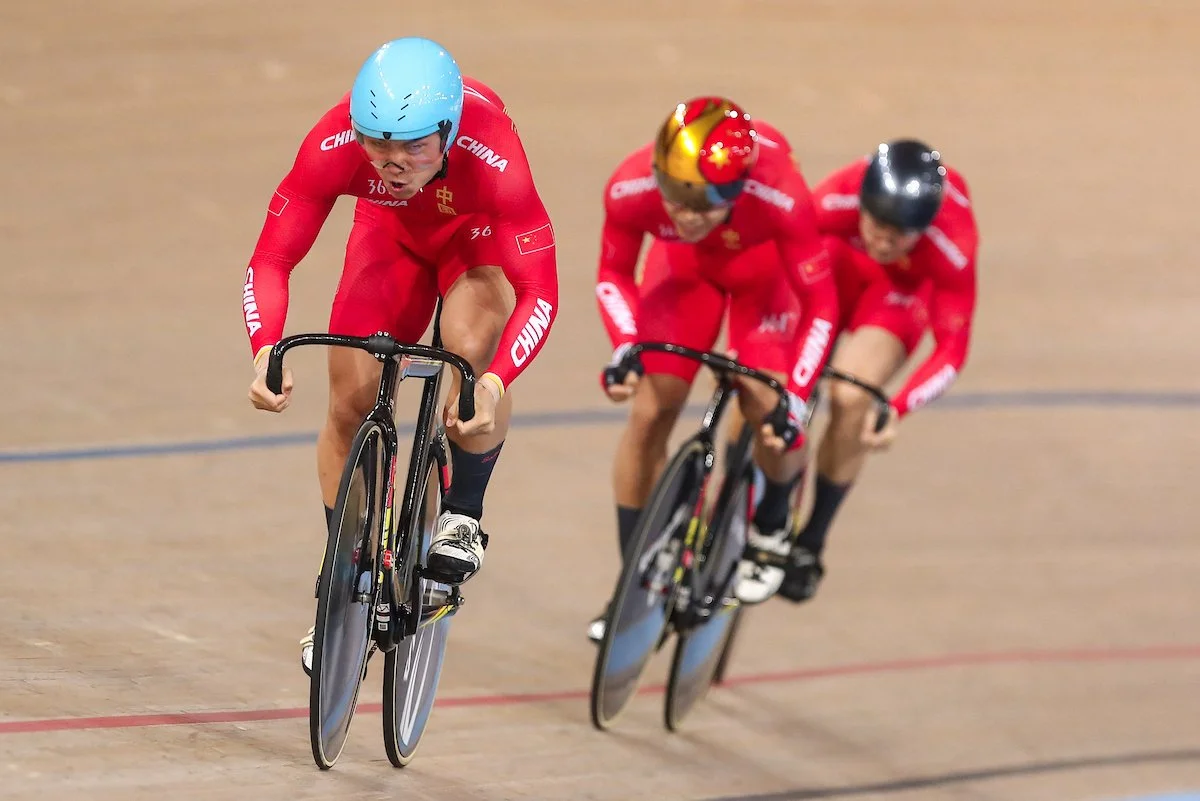
Track Cycling: Team Sprint Data Bank
Every top-8 team sprint ride broken into position 1, 2 and 3 down to the half-lap: compare up to five rides, see where the whole field sits each year, and the fastest laps and segments ever ridden. Men 2013–2026, women since the 3-rider format.