What It Takes to Win — And What It Took From Us (Part 1 of 3)
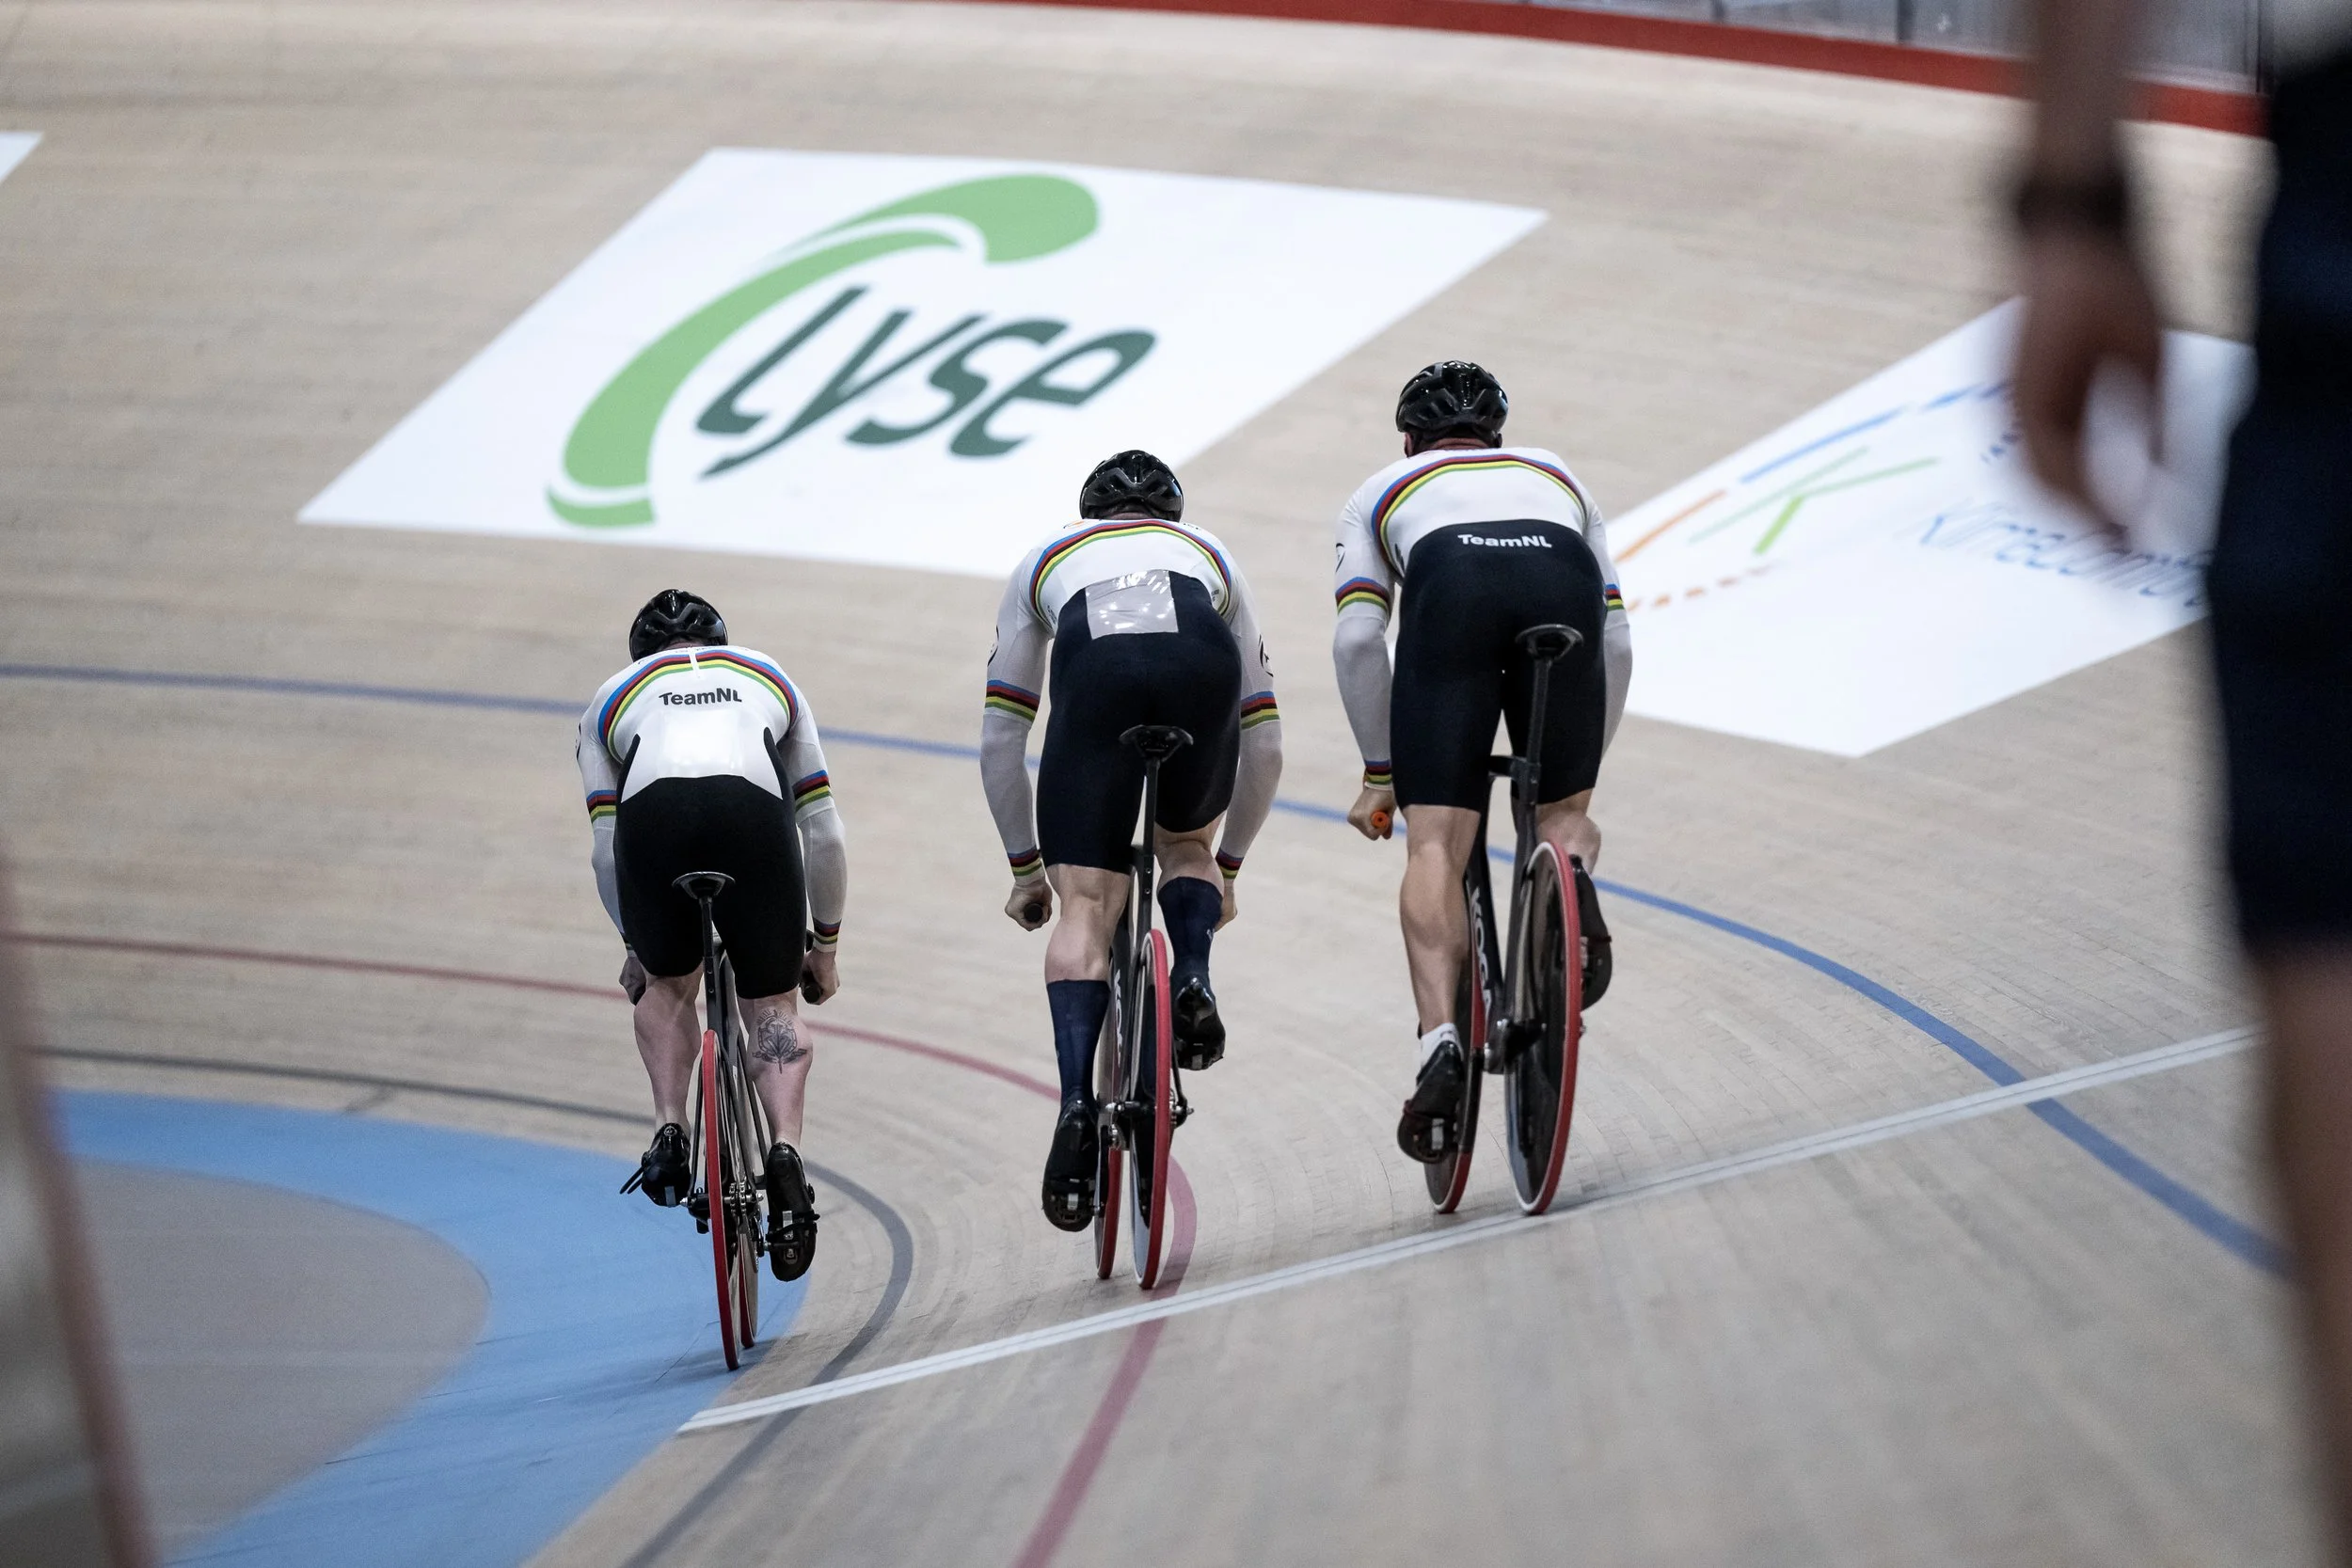
Watching the Dutch Men’s Team Sprint training at our Olympic training camp in Norway.
I have built “What It Takes to Win” models twice in Olympic cycles during my time in track cycling.
Both times, it failed.
I genuinely believed I was being progressive. I predicted the winning times for upcoming World Championships and Olympic Games using data that was rational, structured and, on the surface, evidence-based. I was certain the predicted winning time needed to be met if we were going to have any chance of success. Everything pointed toward that number.
Training became binary. You were either “on trajectory” or “off track.” If you were on track, there was relief — not enjoyment. Just confirmation. If you were off track, even marginally, there was tension. Mild panic. Doubt. Even when athletes improved — if it wasn’t aligned with the model’s trajectory — it felt like failure.
That’s when something subtle but damaging happened. A wedge appeared between me and the athletes. They felt monitored. Judged. Measured. Humans do not progress linearly or predictably. Form fluctuates and adaptation is messy. Confidence, sleep, stress, competition context — they all influence output. Not just training.
Yet the model demanded linearity.
I’ve even seen programmes attach abstract gym strength targets to WITTW projections. The assumption: increase squat by X increases peak power on the bike by Y which has a decrease performance time by Z.
But there is no clean input–output relationship in elite performance. Association is not inevitability.
The Illusion of Predictability
We are told WITTW is simple:
Define the winning time.
Work backwards.
Align everything to it.
Let’s test that idea with data.
Olympic winning times of the Men’s Team Sprint
2008: 43.128
2012: 42.600
2016: 42.440
2021: 41.369
2024: 40.949 (landmark sub-41 world record)
The 2024 Olympic performance felt like a reset. A barrier broken.
Twelve months later, the 2025 World Championship was won in 41.69.
If sub-41 redefined the event, why didn’t it hold?
Already, the “inevitable red line” starts to wobble.
Now project the winning time in LA 2028:
Using entirely defensible modelling approaches, the 2028 Olympic winning time could plausibly be:
40.85 — plateau
40.72 — diminishing returns
40.55 — recent-era linear
40.40 — full Olympic linear
40.20 — engineering breakthrough
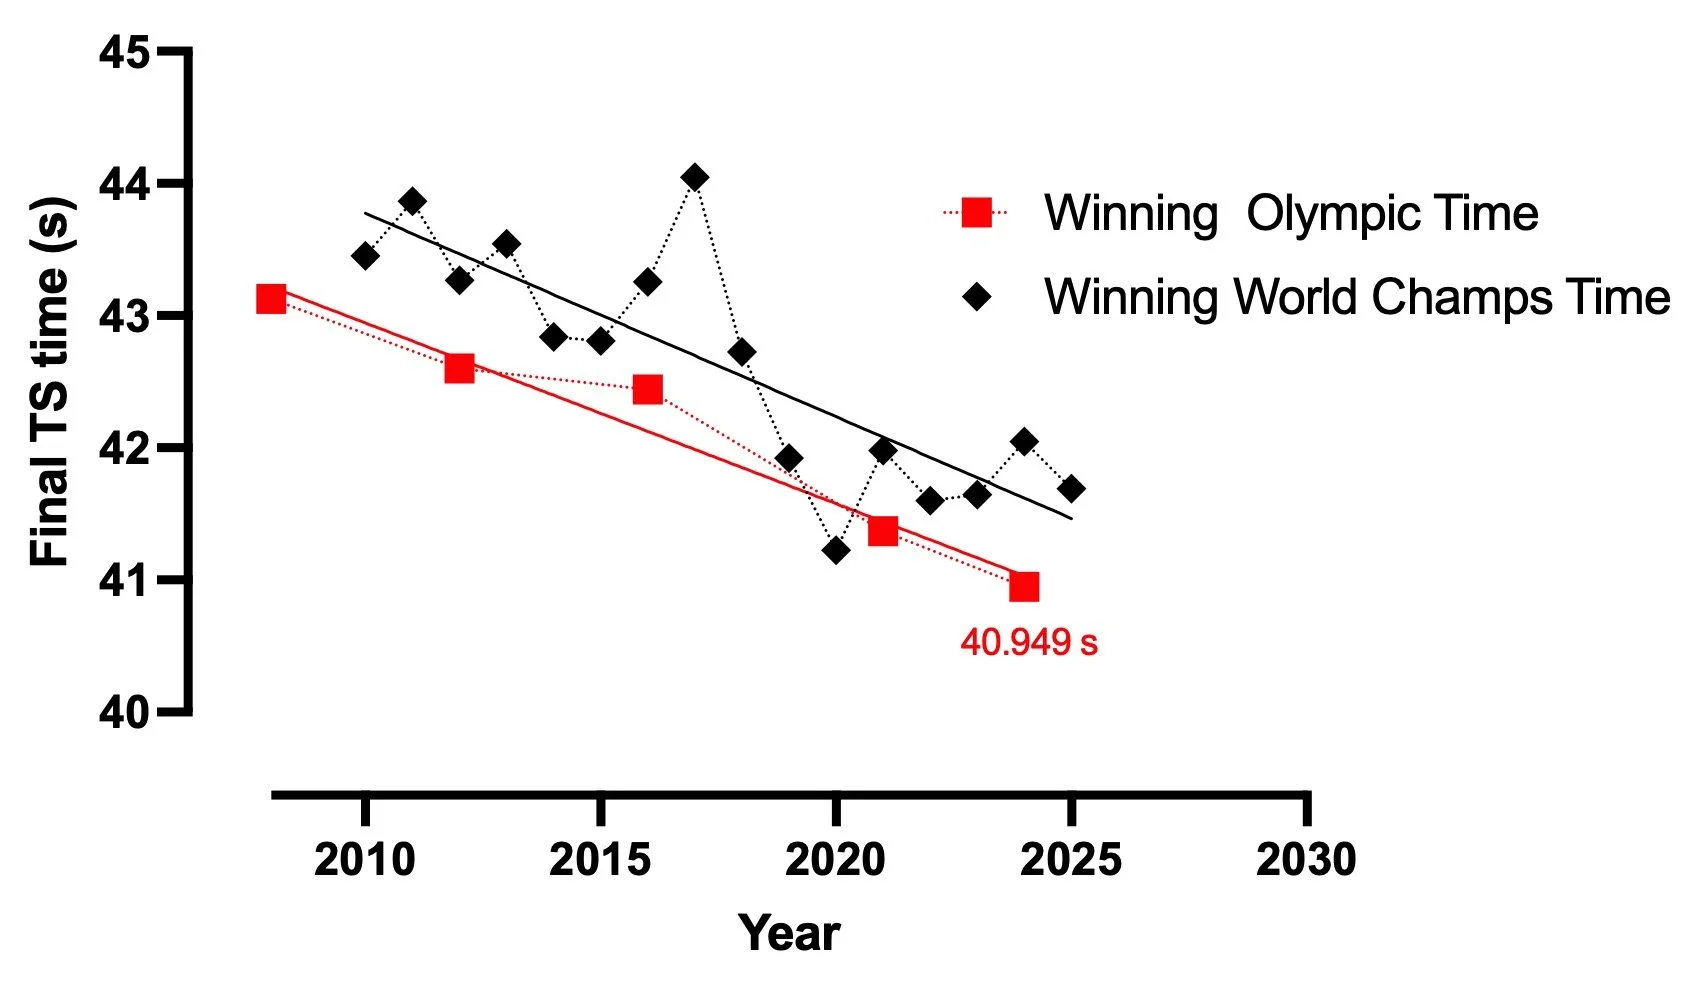
The winning times of the Men’s Team Sprint at the World Championships and Olympic games since 2008.
All of these are justifiable from the same data. From 40.949, that’s between 0.7% and 1.8% faster on what is already thought of being a landmark time and a world-record for the ages.
Because sprint performance scales non-linearly, 3% faster in time implies roughly 6–9% more effective race power. At this level, that is structural change.
So what are we asking for?
Is that physiological?
Is that engineering?
Or is the projection wrong?
The Two Moments That Changed My View
The first time I used WITTW, the athlete hit every KPI.
Power numbers? Aerodynamic targets? Training times? All achieved.
The model said we should win. We didn’t. We “underperformed” badly and didn’t even finish with a medal. The standard had moved on.
The second time, the athlete was nowhere near the projected targets. The spreadsheet said we weren’t ready. We won. On both occasions, trust shifted. When it went badly, suspicion crept in: If the model said we were ready, why weren’t we?
When it went well, another doubt surfaced: If the model was wrong, what else are we treating as certainty?
That was when I realised something important: Evidence-based does not automatically mean good evidence.
And a projection is not truth.
So do we know what it takes to win? If we did, life and performance would be a lot simpler…